tl;dr – link a table of data (that includes a location) to a Google Map to map out anything you like. Follow Google’s on-screen instructions to import your data file and adjust how your map looks and how public it is.

There are lots of ways of creating shareable maps on Google including dropping pins on it, drawing routes and so on. This post talks about how to import information contained in a table in Google Sheets (Google’s equivalent of Excel spreadsheets) and then have it show up on a map.
I’ve recently done this for all the open air film screenings that are happening in London this year. It was pretty easy so I thought I’d blog it.
You will need
- A data source with addresses, an easy option to use is Google Sheets
- A Google account (e.g. Gmail address) and Google’s My Maps
More technically minded people who know what an API is or how to interact with one will probably like this page: Layers | Maps JavaScript API.
1. A data source with addresses
You’ll need at least one column that contains an address of some sort (post code, venue name, city) and it’s fine to have more than one (eg three: venue, city and post code), and then whatever you want in the other columns. Below is what my ‘database’ looks like. The first, second and fourth columns (headings highlighted in yellow) are the ones I tell Google to use to ‘geocode’ the film screenings, i.e. Google will use that info to place a small marker on the venue.
You can use a file on your own computer or a Google Sheet spreadsheet.

2. Google’s My Maps
A) Visit https://www.google.com/maps/d/u/0/
B) Click on Create a new map…

C) …then the link to choose your data source.
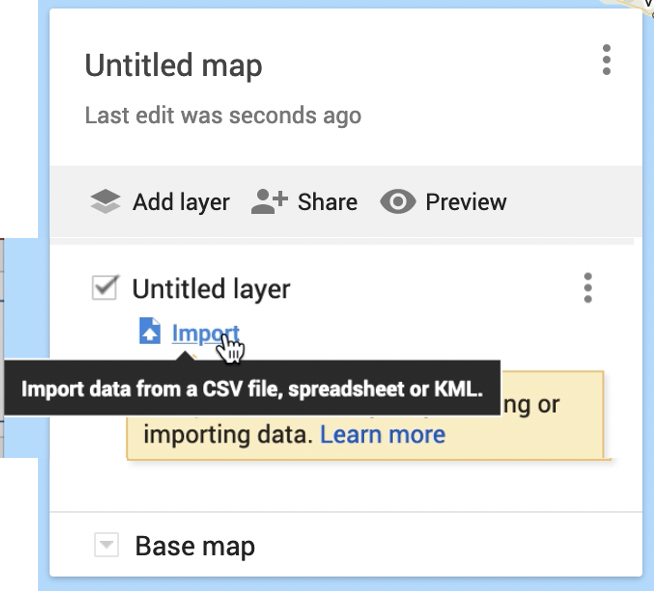
In the picture above you get a message when you hover over the Import link that says “Import data from a CSV file, spreadsheet or KML” (KML is a map format). That text is currently hiding a yellow panel whose text says “Add places to this layer by drawing or importing data. Learn more“.
D) Select the location of your data file
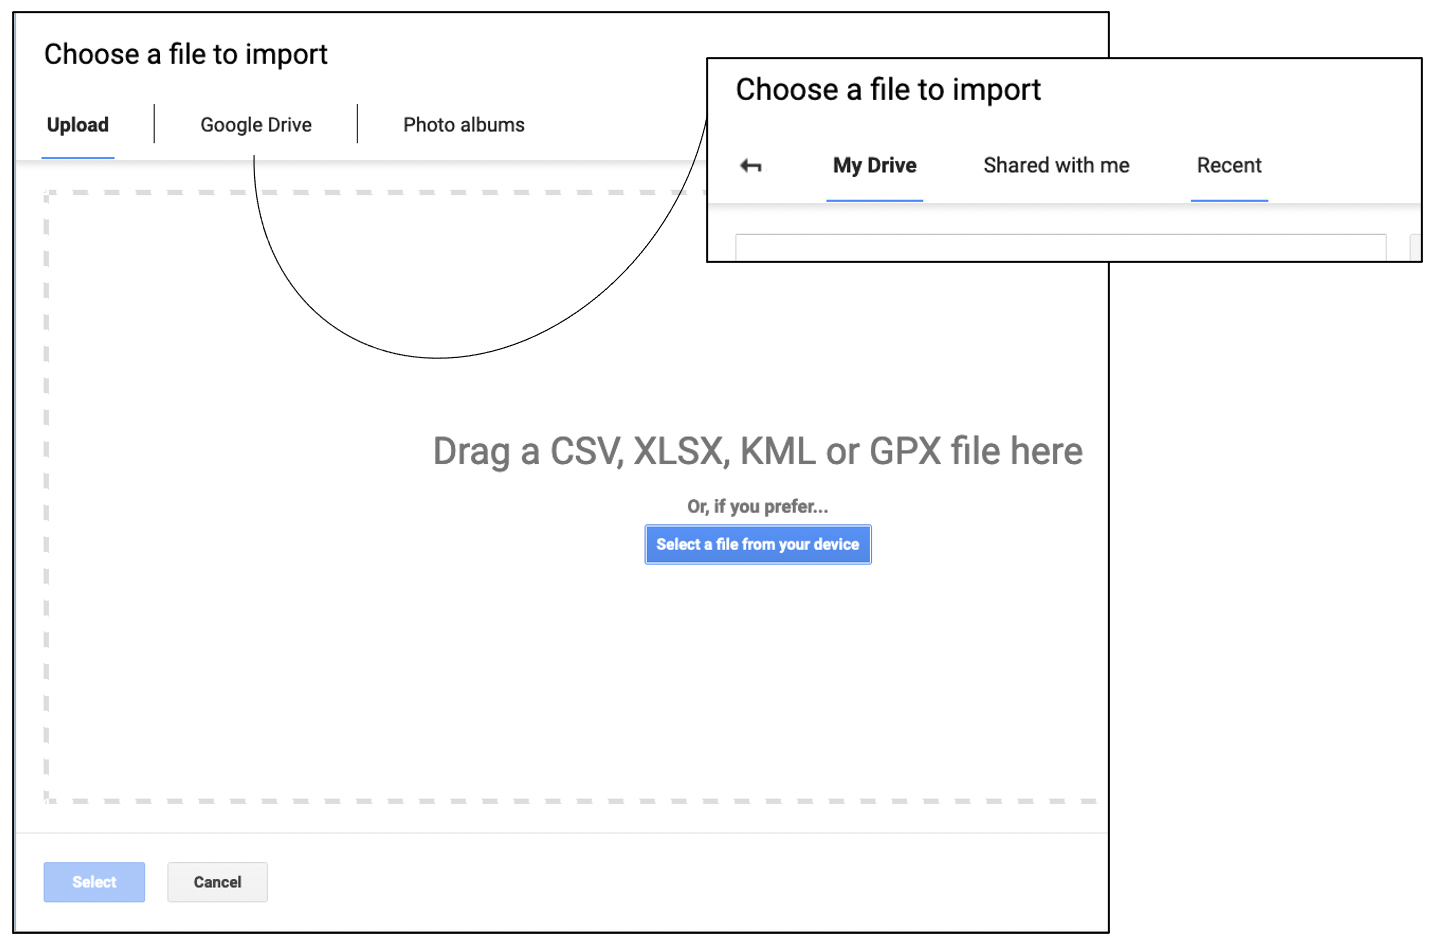
I used the middle option, Google Drive, and then selected ‘Recent’ because I’d just been working on the relevant spreadsheet.
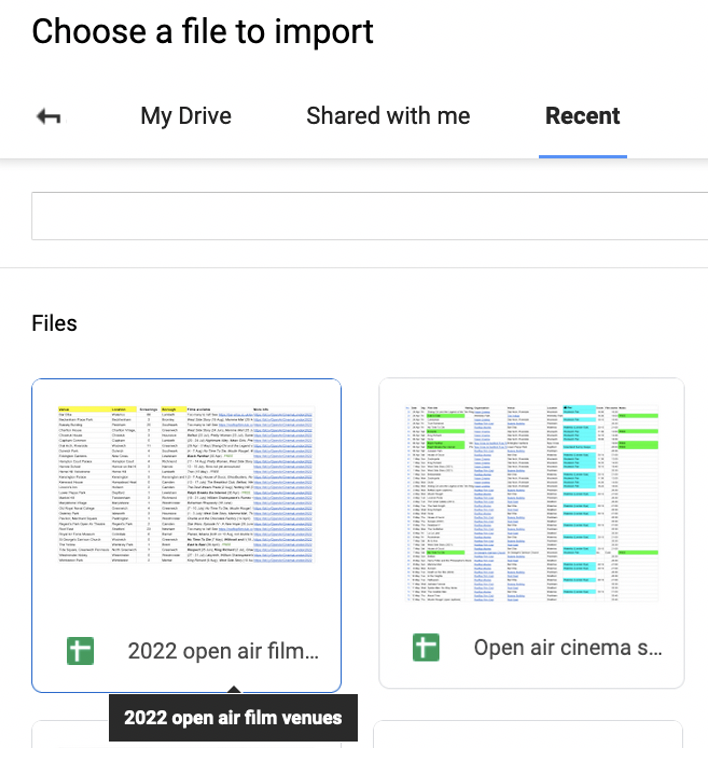
E) Choose your data file to import
F) Geocode your map

This ensures that your film screening is accurately placed in London, England and not in Canada, for example.
G) Choose the column which will be the title for the placemarkers

Once you’ve made your selection click the blue Finish button that will be active below the list of column names. I chose the venue name so that when you click on the map icon it titles the little box that pops – which looks like this.

H) Your map should now look like this
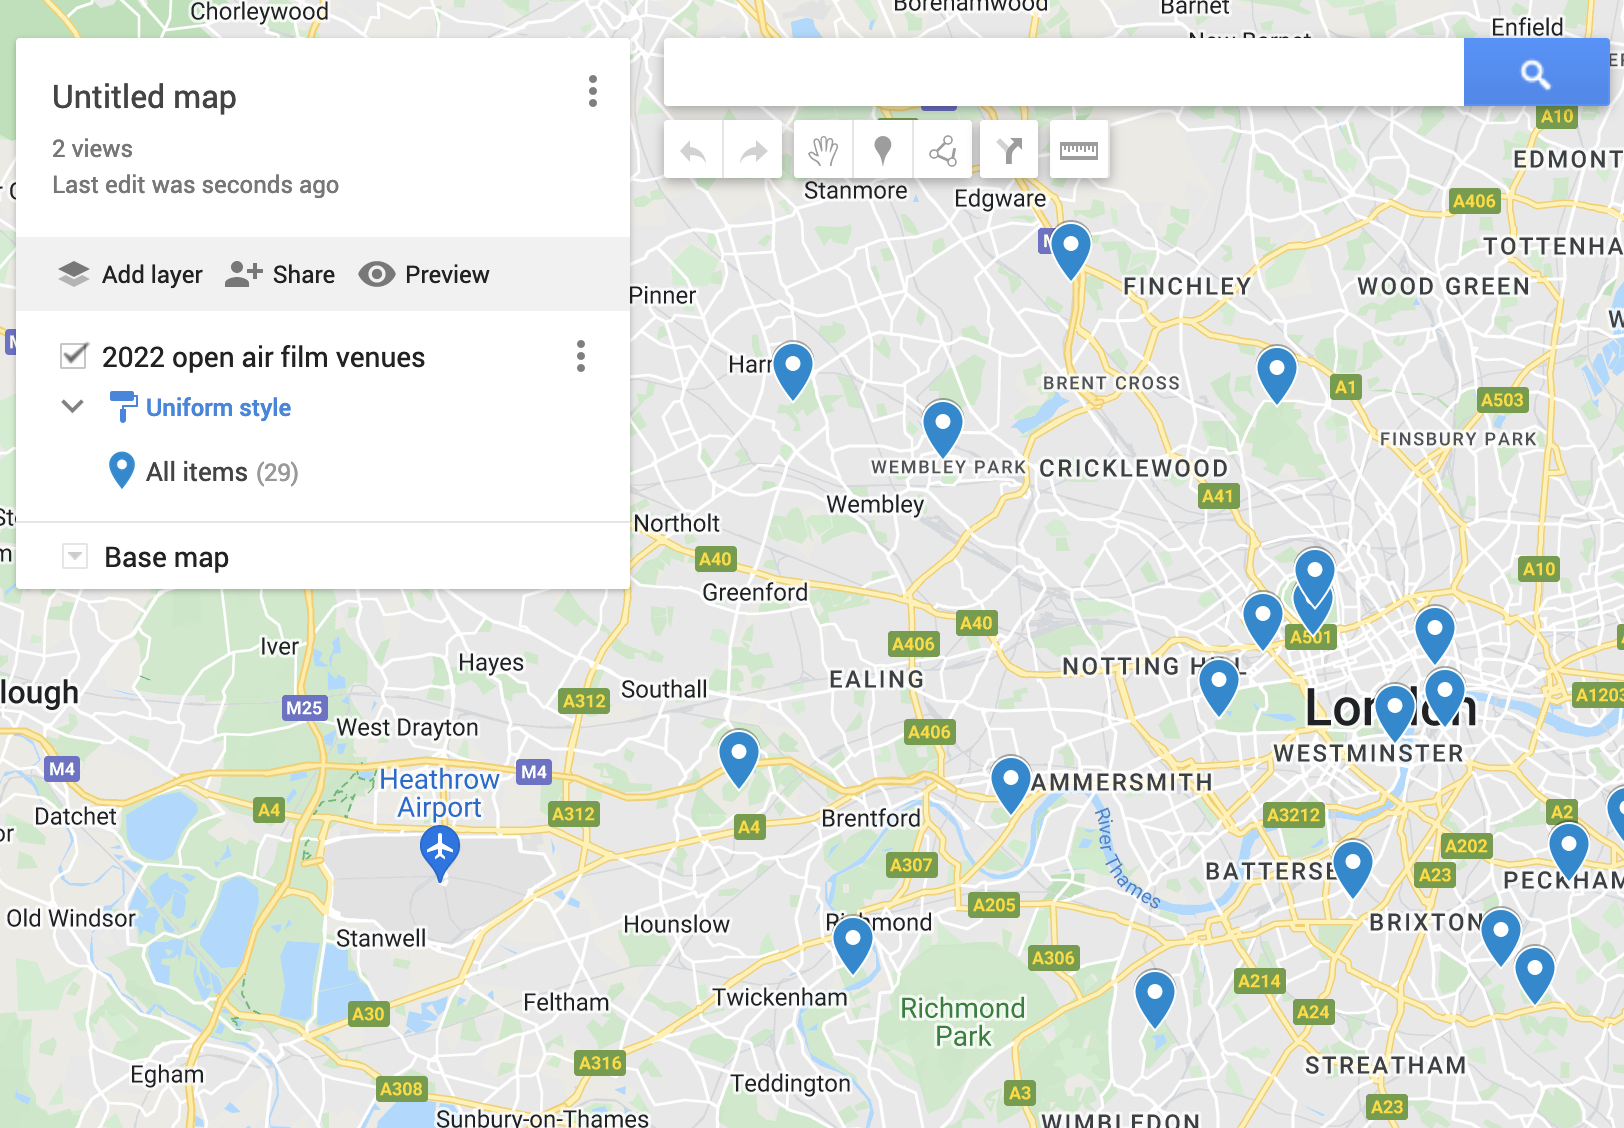
Above is what your newly created map will look like, with the placemarkers in default blue.
i) Edit the name and description

Click on the bit saying ‘Untitled map’ in (h) to add a name and then the description below it.
J) Edit the markers
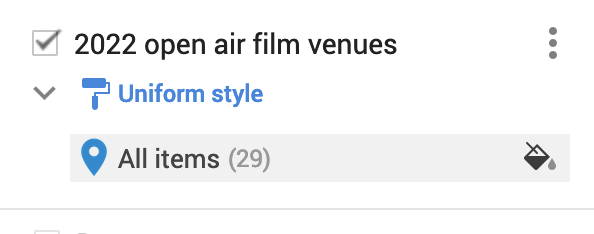
Hover over the bit that says ‘All items’ and a colour dropper will appear, click to change colour and icon.
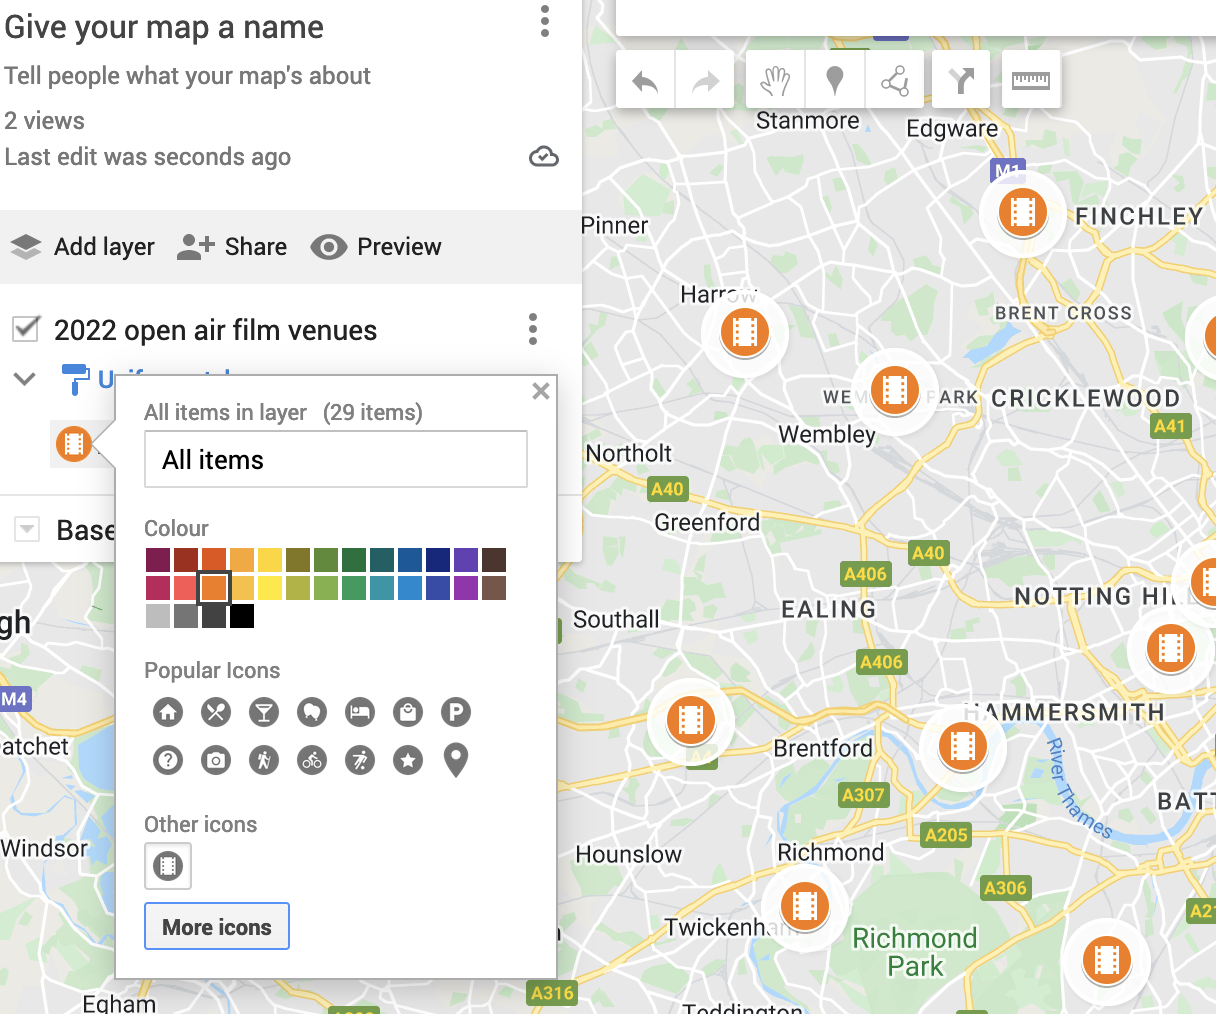
K) Change colour and icon
Click on the colour you want for the placemarker. Click on More icons to see the full range – you can also search. I searched for ‘film’ to pick out the film strip icon.
L) Your map now looks like this…
M) …and is ready for launch

Note in (L) above that there’s a Share icon in the grey panel below the map renaming field. Click on it to adjust how public and searchable your map is. Mine has all the settings set to blue / on so anyone can see the map, or find it in a search and they can see that I created it.
You can now share your map with the world!
3. Updating your map
There are several ways to do this. Probably the least fiddly is to edit the underlying data (what’s in the Google Sheet, in this case) and then delete and re-import the ‘layer’ (from 2.C onwards). You can use the three overflow dots (vertical version of •••) to bring up the option to delete a layer.

The Open data table lets you edit the content of each cell, you can als add a row or column.

Right-click on a row to add or delete a row, or amend the location marker. You can also click the Add row button at the bottom of the table (not shown in pic). To add a column before or after a column use the small down arrow in the column’s header. To edit a cell just click in it and start typing. Click the X at the top right to close (saving is automatic).
